The aim of this chapter is to help you understand the SQL
Server Execution plan and how to use them to optimize the queries.
Let's first start with What's an Execution Plan is:
An execution plan, simply put, is the result of the query
optimizer's attempt to calculate the most efficient way to implement
the request represented by the T-SQL query you submitted.
Execution plans can tell you how a query will be executed, or
how a query was executed. They are, therefore, the DBA's primary means of troubleshooting
a poorly performing query. Rather than guess at why a given query is performing
thousands of scans, putting your I/O through the roof, you can use the
execution plan to identify the exact piece of SQL code that is causing the
problem. For example, it may be scanning an entire table-worth of data when,
with the proper index, it could simply backpack out only the rows you need. All
this and more is displayed in the execution plan.
Guidelines for reading a SQL Server query
execution plan
·
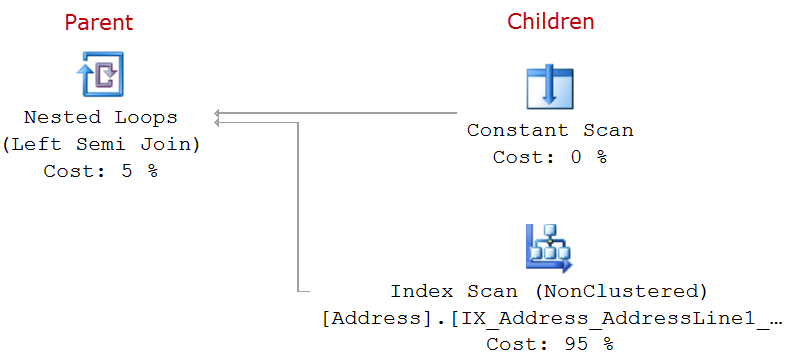
The graphical query execution plan
has a shape of a tree. The tree structure depends on the statements in the
query
- Each query in a batch is shown in the plan
- Each icon presents an operator
- Icons are read from left to right, top to bottom
- The tree shows parent and children-level nodes
- Every child node is connected to a parent node by arrows
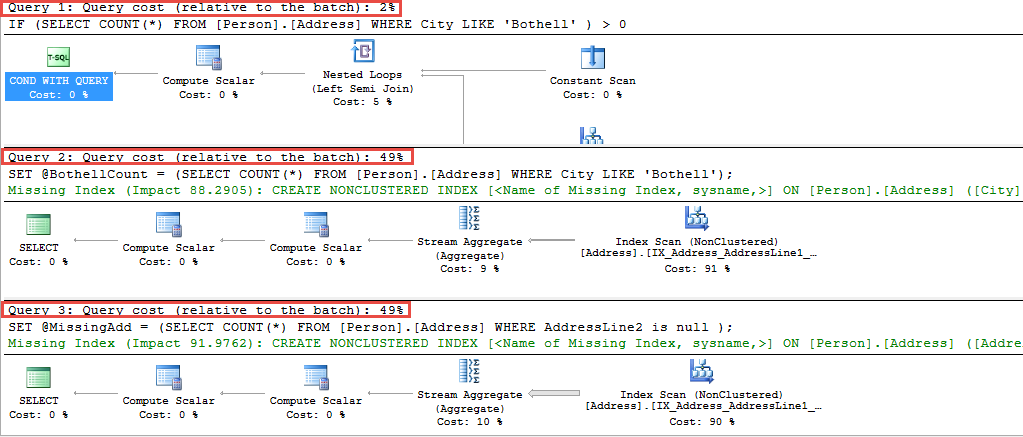
- The cost of each query is presented as a percentage of the total batch cost. The cost is the time needed to execute a statement/query/batch. Total cost of every batch, i.e. the sum of individual query costs should be 100%. However, it is possible that even in the actual query execution plans for costly queries, these costs are miscalculated and the sum is over 100%
· 
- Children of the same parents are placed in the same column. This doesn’t mean that all operators in the same column have the same parent
· 
- The arrow width depends on the actual/estimated number of rows. The arrows that represent a large number of rows are thicker

- ·If a query has multiple queries, query execution plans are drawn one under another. The relative cost for each query is presented as a percentage of total cost of all statements. The sum of all query costs is 100%
Operators show how queries and statements are executed. They can
be physical and logical. Logical operators present an operation on a conceptual
level, while physical operators implement the operation defined by the logical
operator using a specific method. In other words, a physical operator is an
object or routine that executes an operation. Physical operators access columns
and rows in tables and views, calculate expressions, create joins, etc.
Optimizing query by reading plan
Let's take the below query as an example:
DECLARE @LocationName AS NVARCHAR(50);
SET @LocationName = 'Paint';
SELECT p.Name AS ProductName ,
pi.Shelf ,
l.Name AS LocationName
FROM Production.Product AS p
JOIN Production.ProductInventory AS pi ON pi.ProductID = p.ProductID
JOIN Production.Location AS l ON l.LocationID = pi.LocationID
WHERE LTRIM(RTRIM(l.Name)) = @LocationName;
GO
When this query is executed, you'll see the execution plan as
below:

There are several issues that needs to be addressed in this plan:
1.
The Index Scan on
the Location.Name column – there's an index on that column it should
have used the seek
2.
The fat pipe coming
out of the Clustered Index Scan on the ProductInventory table
– in this example, it's processing over 1000 rows at this stage, and eventually
only returning 9 rows.
3.
The Hash Match join
– for the number of rows returned where we are expecting a Nested Loops join.
4.
The Clustered
Index Seek on the Product table looks very expensive relative
to the other operators.
When we look into the code, it becomes clear that its not using
the SEEK because of the function used on the Location.Name column, LTRIM(RTRIM(l.Name)).
We can then remove that function and rerun the query and the plan would change
to:

Now that the Location rows are accesses with a seek instead of a
scan, SQL Server has a better idea how many rows to expect and so switches to a
more appropriate join type. This is why it's pretty common to see Hash Matches
where there are bad or missing indexes.
To remove the fat pipe connected to the Clustered Index
Scan on ProductInventory, we can create a new index on
ProductInventory table
CREATE INDEX ProductionLocation ON Production.ProductInventory(LocationID)
INCLUDE (Shelf);
New plan look like below

The only thing remaining is to look into the high-cost Clustered
Index Seek. However, once we understand the nature of the Nested
Loops join, it becomes apparent that this is not actually a problem in
this case. During a Nested Loops operation, for each row returned
by the inner data set, it compares it to the outer data set, looking for
matches. In this case, for each row returned fromLocation, SQL Server performs
a seek on the Product table. That explains why the cost is higher.
Operator tooltips
Besides the information presented by the icons and nodes, SQL
Server query execution plans provide much more details in the icon tooltips. To
see the tooltip:
·
Place the mouse over
the icon in the plan, or
·
Right-click the icon
and in the context menu select Properties
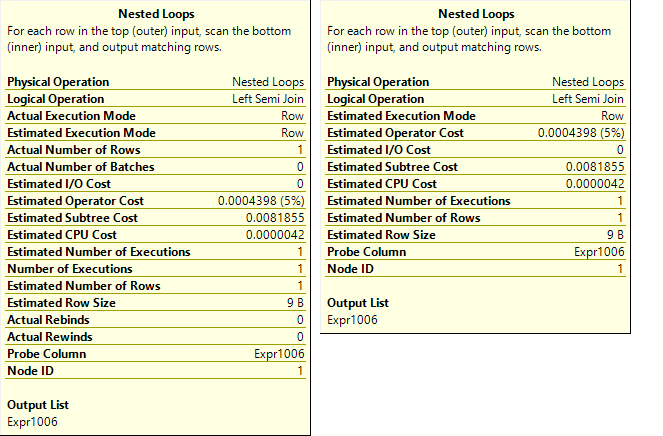
The information shown in tooltips is various and depends on the
operator type. The items shown in the tooltips are different for actual and
estimated plans. The tooltip on the left is for the actual and on the right for
the estimated plan for the same operator

The estimated and actual values for the same parameters may not
be equal in some scenarios
The information available in a tooltip is:
Physical Operation – the object or routine executed, the operator name
presented in the plan
Estimated Operator Cost – the cost of the operation, presented as a percentage of
total batch cost
Estimated I/O Cost, Estimated CPU Cost – Query Analyzer creates several
execution plans, calculates the cost of each (how much I/O and processor
resources are needed to complete the operation), and determines the most
efficient one
Estimated Row Size – the number of rows that is believed to be affected by
the operation, useful for determining how much memory is needed
Actual and Estimate Number of Rows – even if there is significant
discrepancy between these two values, it doesn’t indicate a problem. It’s
usually caused by out of date statistics
Actual and Estimate Execution mode – row or batch, shows whether the rows
are processed one at a time, or in batches
No comments:
Post a Comment